Logarithmic y-axis on investment plots?
rjbailey_95066
Quicken Mac Subscription Member ✭✭
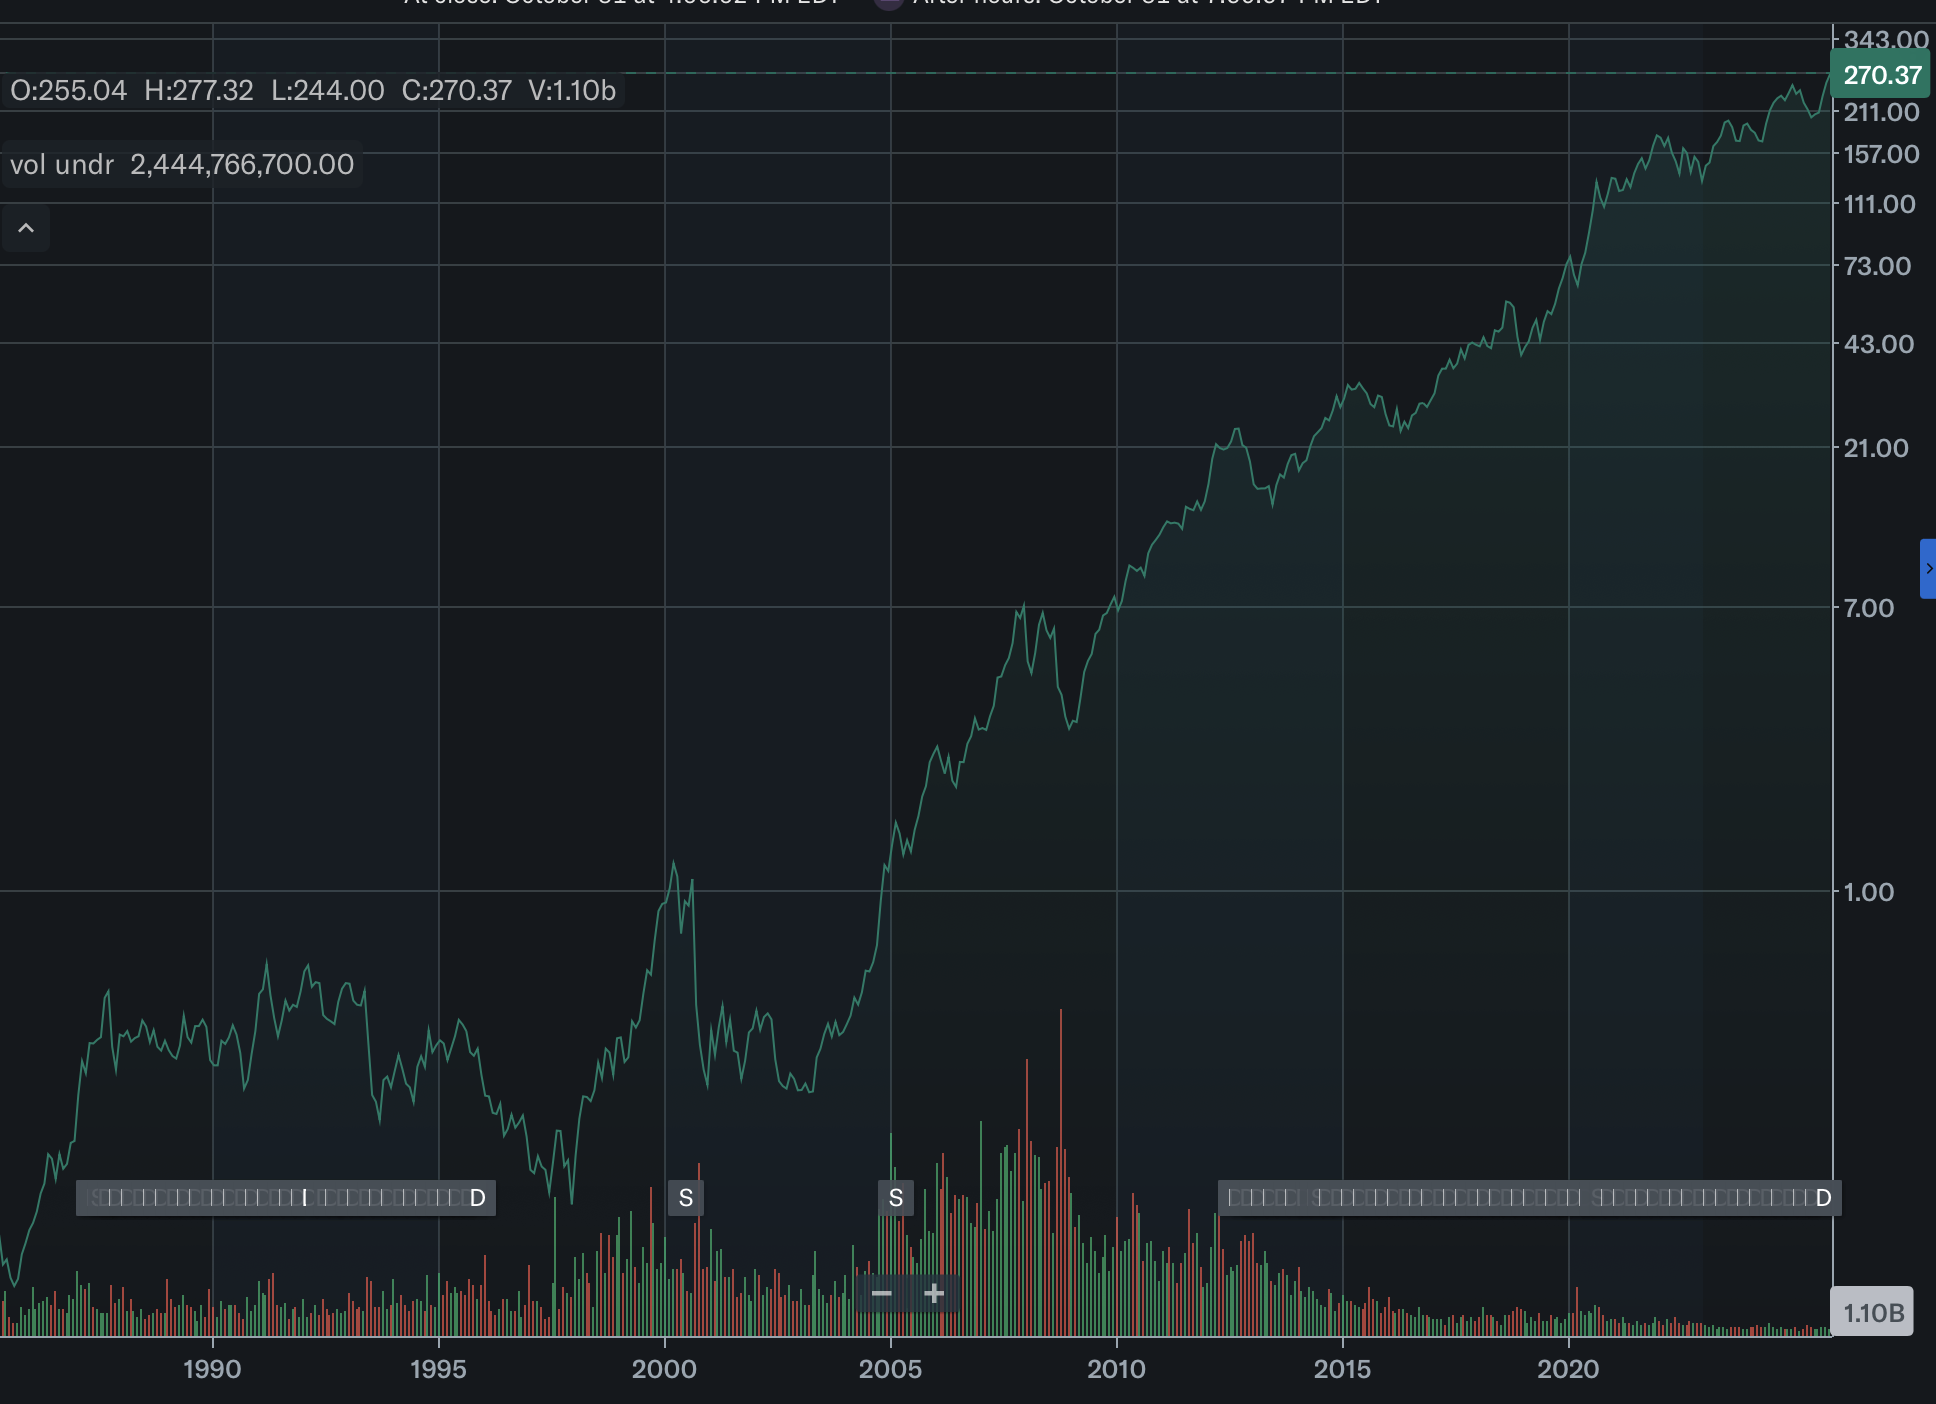
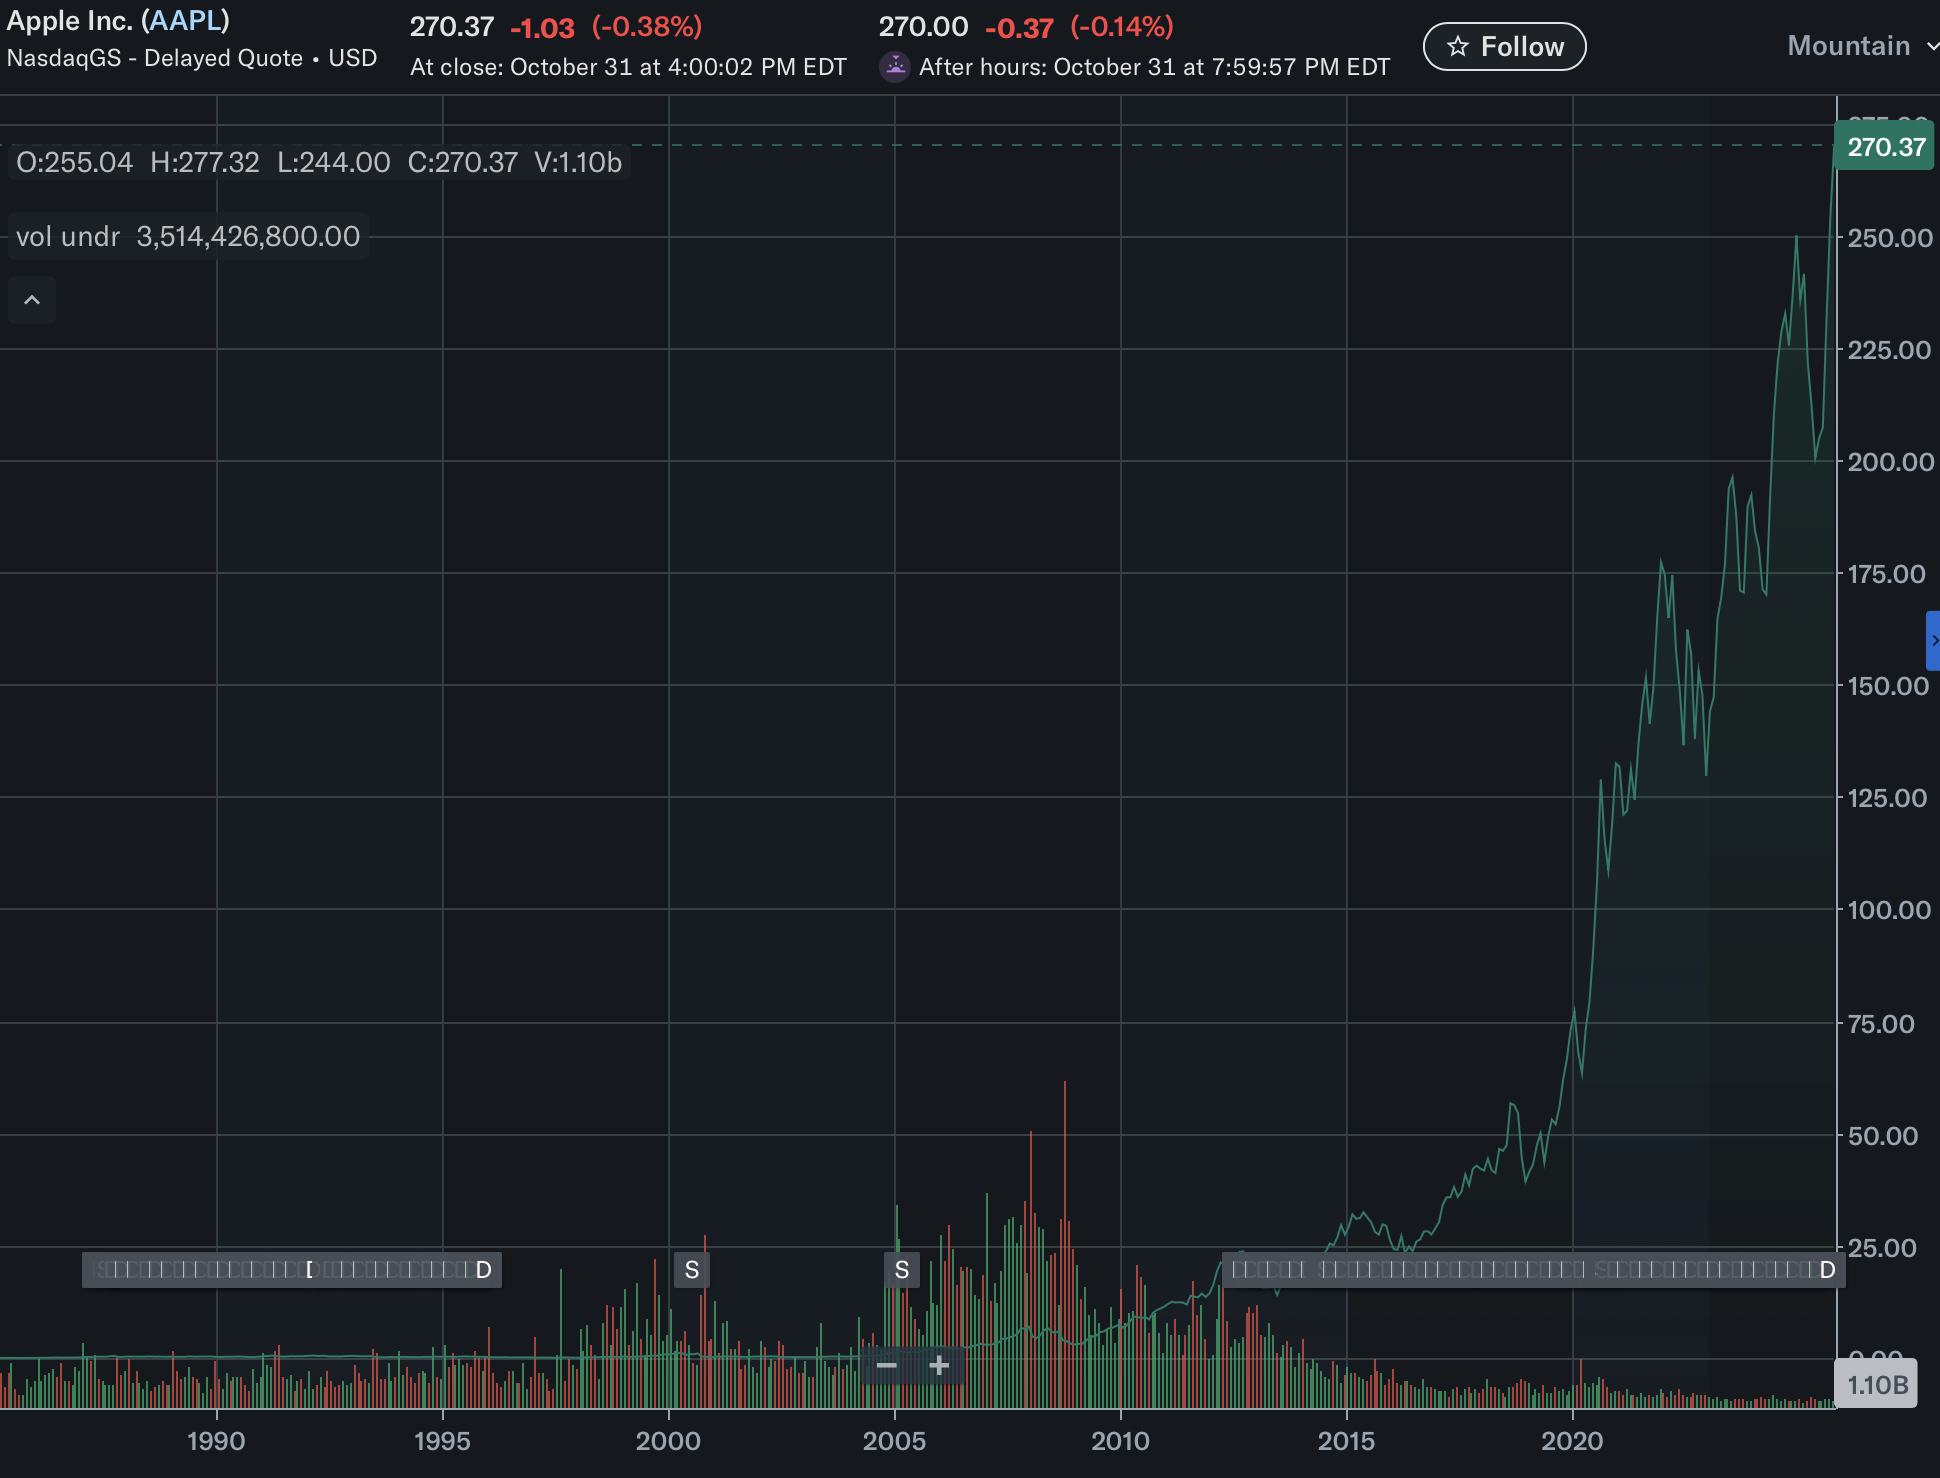
This keeps coming up but going nowhere: how can we request a logarithmic plot on investment plots? The log plot below (upper) is so much more illustrative than the linear plot (lower) for long-term investments.
Tagged:
2
Categories
- All Categories
- 63 Product Ideas
- 36 Announcements
- 225 Alerts, Online Banking & Known Product Issues
- 21 Product Alerts
- 704 Welcome to the Community!
- 673 Before you Buy
- 1.2K Product Ideas
- 54K Quicken Classic for Windows
- 16.4K Quicken Classic for Mac
- 1K Quicken Mobile
- 812 Quicken on the Web
- 115 Quicken LifeHub

