Mysterious increase/decrease in Fidelity Brokerage

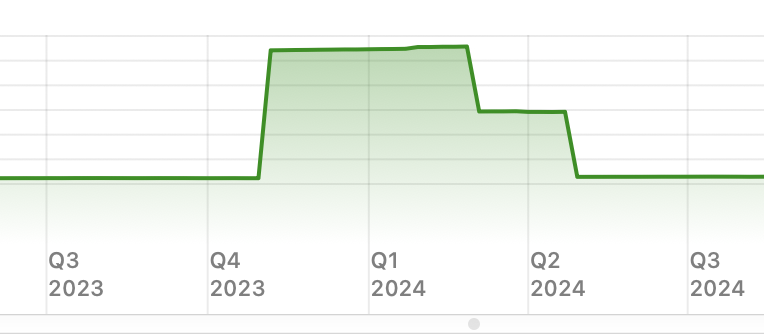
My Fidelity Brokerage Portfolio chart shows a huge increase in the balance in Nov 2023, then drops in March 2024 and then again in April. This also shows up in a net worth report. There are no transactions in the register to account for this. Thoughts? I am using Quicken Classic Business & Personal Version 8.3.2 (Build 803.58902.100) with Mac OS 26.0.1
Best Answer
-
If there are no transactions to explain the increase value then I would look at investment prices. Go through the investments in your Fidelity account to try to narrow down which specific one is going up & down and then look at the price history for that investment. You can see the price history by going to the Securities window, editing the security, and then clicking on the Price History tab.
1
Answers
-
If there are no transactions to explain the increase value then I would look at investment prices. Go through the investments in your Fidelity account to try to narrow down which specific one is going up & down and then look at the price history for that investment. You can see the price history by going to the Securities window, editing the security, and then clicking on the Price History tab.
1 -
I'm having the same issue - a Fidelity IRA account and a brokerage account that more than doubled in value in June '25 and March '25 respectively, and dropped to the correct levels in Sept '25. There are no transactions at those times that would increase the portfolio and all the Price History in the Security Detail are all in proportion to market movements. Any recommendations / insights appreciated.
0