Investment Chart Displays Sawtooth Pattern #2

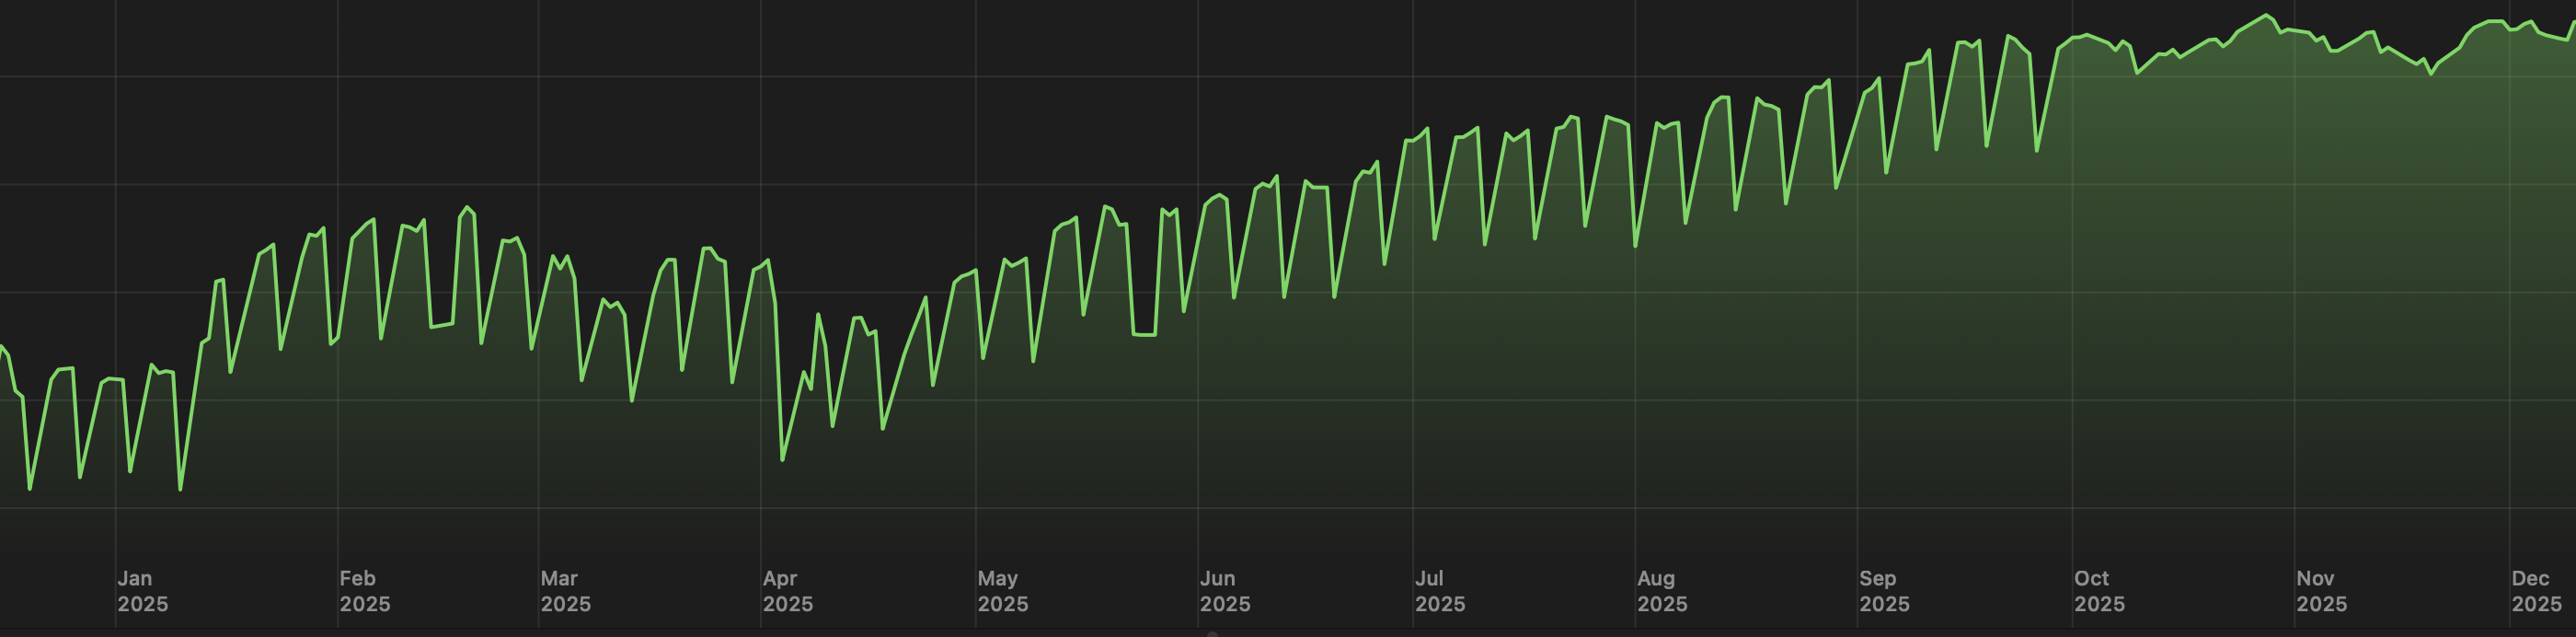
I’m having the exact same problem @PhilP` posted about a couple months ago. Just showed up when I looked at my ADP 401k this AM, only in the 1 year graph. Think this is a more systemic problem than one account.
Comments
-
Did you have a stock split? This pattern looks similar to several other posts about incorrect portfolio value calculations after a stock split. Quicken Mac somehow incorrectly changes some pre-split prices to post split prices. Thus the portfolio value is incorrect for those days prior to the split when Quicken uses the post-split price to calculate portfolio value. This causes the graph to have the sawtooth problem reflecting the incorrect calculation of the portfolio value on multiple occasions.
0 -
I did have a 16:1 split in one of my mutual funds in October. So this Quicken Mac issue you describe could explain it. Thank you very much James!
0