Graphs & Reports - When will this years long issue finally be fixed?
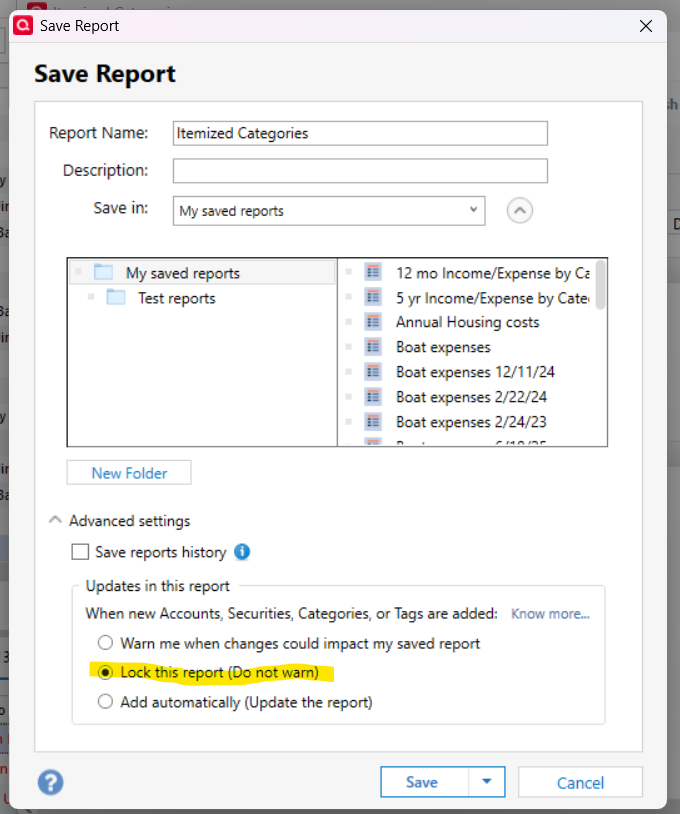
I've used Quicken for over 25 years and it STILL will not retain the settings I choose in graphs and reports. No matter how many times I "customize" and "save", the settings do not retain.
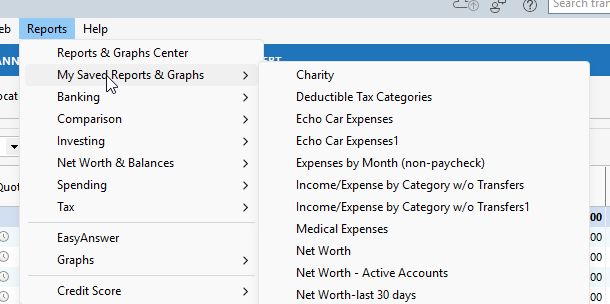
Specifically under Categories. Periodically, my graphs and reports will revert to include asset and liability accounts which are not even related to an Income vs Expense report or graph. The Expenses graphs also include asset and liability accounts.
Does anyone on here have any insight as to what Intuit has to say about this? Will this ever be fixed? There are so few other options for personal finance software and I have no migration path to something else.
Will we forever not be able to rely on graphs and reports? Do accountants not review/QA this software?
Comments
-
Going back almost 30 years, I am not experiencing this issue and never have. Have you tried uninstalling and reinstalling the Quicken program software?
0 -
Saving the settings of a report does not change the default settings of ALL reports, just that saved version of the report.
Are you selecting the saved report when you run it?
-splasher using Q continuously since 1996
- Subscription Quicken - Win11 and QW2013 - Win11
-Questions? Check out the Quicken Windows FAQ list1
Categories
- All Categories
- 60 Product Ideas
- 36 Announcements
- 216 Alerts, Online Banking & Known Product Issues
- 21 Product Alerts
- 704 Welcome to the Community!
- 671 Before you Buy
- 1.2K Product Ideas
- 53.9K Quicken Classic for Windows
- 16.4K Quicken Classic for Mac
- 1K Quicken Mobile
- 812 Quicken on the Web
- 115 Quicken LifeHub


