What is the best way to calculate CAGR (not IRR) in Quicken Deluxe
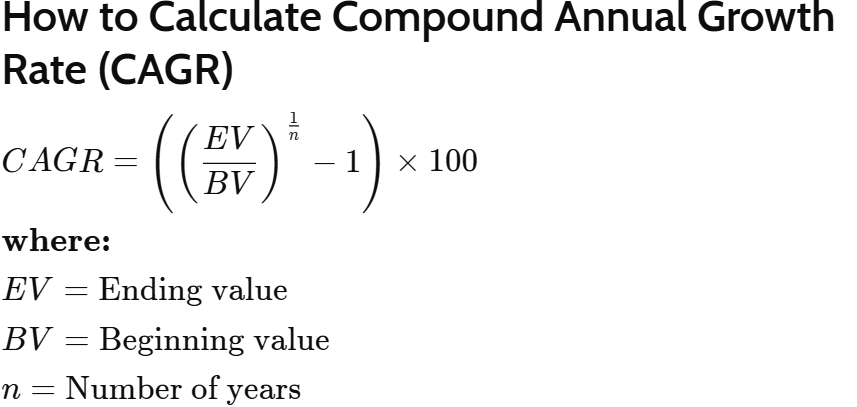
I need to calculate CAGR (Compound Average Growth Rate). The formula is below. Quicken Deluxe does not provide a report to get this directly. What I have done is use the Investment Performance Report, select the criteria for type of investment, investing goals, etc., set dates from the beginning of a year to the end of year (e.g., 1/1/2009 to 12/31/25) and then view the report sub-totaled by year. This gives the BV and EV (see image below) for each year. I export the file to Excel and filter it to get just BV and EV for each. Then apply the formula.
Is there a more direct way to get this from Quicken?
Answers
-
It looks like that formula will ignore money added to or withdrawn from the portfolio over the time period. Is that what you want?
Also in Premier (maybe in Deluxe?) there is the Net Worth & Balances > Lifetime Overview report. The total at the bottom is labelled CAGR but as discussed here
it appears that the calculation is wrong. As far as I know this was never corrected.
QWin Premier subscription0 -
Yes, CAGR is the typical calculation used by stocks and mutual fund prospectus' to show how the growth of a fixed initial investment (usually $10K I think) grows over a period of time. It is useful to compare performance. @bbuckley is using the same formula I showed, which came directly from Investopedia.
I don't have access to the lifetime report in Deluxe. Regardless I have very little faith in any of Quicken return calculations - they show little transparency to easy check their calculations. I see numberous posts here calling out incorrect or inconsistent calculations.
Nevertheless, I did suggest the way I choose to calculated CAGR and it works and with simple inputs that can be easily verified in Quicken; just somewhat time consuming so I am searching for a better way.20+ years as a Quicken User. Deluxe Subscription - Win100 -
To each their own, but I find the IRR as calculated by Quicken's Investment Performance Report and in the Avg. Annual Return (%) columns in the Portfolio views to be the most useful measures of my investment performance. The IRR takes into account the amounts and timing of cash flows, what Morningstar calls Personal Return or Investor Return. See this article
QWin Premier subscription0 -
I understand. I have checked the same IRR in that Quicken report and it agrees with an XIRR calculation in Excel. However, depending on the timing of cash flows, particularly large ones early in the time frame, it can give a terribly distorted numbers that defy common sense.
20+ years as a Quicken User. Deluxe Subscription - Win100 -
I have not seen distorted results with Quicken's IRR calculations in the Portfolio views or the Investment Performance Report. For me, they always agree with the Excel XIRR function. Can you provide an example of this problem?
Note that the IRR calculation is annualized. If you set the date range to less than one year, the percentages shown assume that the performance will continue at the same rate for a full year. This is useful for fixed price securities like money market funds, but not so much for other securities.
However there is a way to see YTD return on the IPR or Portfolio views. If you set the IPR date range to Yearly and Current year, the report shows YTD gains or losses assuming that the security prices are flat and there are no further cash flows for the rest of the year. In the Portfolio views, this is the same as setting the "As of" date to 12/31 of the current year and looking at the "Avg. Annual Return (%) 1-Year" column. There may be some differences between the reported percentages and those shown elsewhere, depending on the timing of any purchases or sales you have made during the period and whether or not you have reinvested any dividends or other distributions.
QWin Premier subscription0 -
Perhaps my words were not precise enough. I related that the Investment Performance Report Ave. Annual Return that Quicken generated was identical to an excel XIRR calculation from the list of cash flows I extracted from that Quicken Investment Performance Report. So in this instance that Quicken report is accurate.
But my point was that IRR (or XIRR) can be misleading and distort your impression of your returns. I did an analysis of my portfolio with Quicken (verified with excel XIRR) and came up with >80% Ave. Annual Return over 25+ years. That was non-sensical and a detailed look into the yearly returns showed that in a few early years some substantial gains in a few stocks were responsible.I have attached a chat with the Gemini AI app that you might find interesting. The TWR calculation mentioned near the end is similar to the CAGR I previously mentioned. Some AI can be misguided so if you are really interested check out the same prompts in other AI apps like ChatGPT.
20+ years as a Quicken User. Deluxe Subscription - Win100 -
We have previously had discussions about time weighted returns vs Quicken's IRR. They can each be useful, but in different circumstances.
I prefer to consult authoritative sources rather than AI.
QWin Premier subscription0 -
It would be useful if you could give references to those authoritative sources, preferably with links. Also, references to prior discussions on time weighted returns versus Quicken IRR. Thanks.
20+ years as a Quicken User. Deluxe Subscription - Win100 -
I already linked a Morningstar article
Also see this earlier discussion and the even earlier discussion linked from that, which includes other links.
This Wikipedia article is also useful.
QWin Premier subscription0
Categories
- All Categories
- 49 Product Ideas
- 35 Announcements
- 225 Alerts, Online Banking & Known Product Issues
- 18 Product Alerts
- 504 Welcome to the Community!
- 673 Before you Buy
- 1.4K Product Ideas
- 54.9K Quicken Classic for Windows
- 16.6K Quicken Classic for Mac
- 1K Quicken Mobile
- 824 Quicken on the Web
- 120 Quicken LifeHub

