Incorrect Share Balance after 16 for 1 Split

I hold DOXGX and it split 16 for 1 on 10/24. Quicken shows I have 189.174 shares on 10/13. When I enter the split as 16 new for 1 old, Quicken shows 3026.783993 shares … instead of 3026.784.
Why does this not come out a nice clean number?
Also, I did not enter the optional price after the split and the investment report shows a crazy avg annual returns for 3-year and 5-year. Is this because I did not enter the price after the split?
Answers
-
As to your first question, seeing this kind of "miscalculation" isn't all that rare; I experience one of those too in my own holdings of 3 different Dodge & Cox funds. It might very well come down the limitations of finite precision in the binary system, which causes rounding errors for numbers that cannot be represented exactly.
You do need to keep the stock quote in sync with the change in the number of shares caused by the split or you'll end up with errors in the metrics. Prices in the window around 10/24 are:
10/30 $17.19
10/29 $17.38
10/28 $17.72
10/27 $17.78
10/24 $17.67
so correct you price history for for whatever incorrect quote is showing up in DOXGX's price history on the date the split got recorded in Quicken.
0 -
Thanks Tom Young.
What is your recommended fix for returning the "miscalculation" of shares to match the number reported by the financial institution (xxx.174)?
Also, I deleted the old split where I did not enter the optional price after the split on 10/24. Then I re-entered the 16:1 split with the 17.67 price after split. Checking again on the Investment tab, avg annual return 3y, 5y both show the same 221% gain… which was not true before the split. The 1 year avg annual return shows 5.87%. What other ideas do you have to correct the investment returns for this fund post split?0 -
Share count - My first step would be to use the Portfolio View (Ctrl-u), customize as desired, grouped by Account. Expand to show lots (click + next to security). Set the As of date to before the split. (10/27/25?)
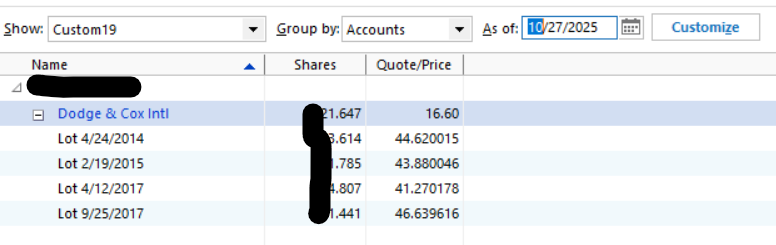
Do any lots show an undesired number of digits? If so go back and correct any applicable transaction. One that created to bad quantity by a buy, sell, or reinvestment. As you can see, in my case all four lots were 3-decimal precision before the split and remained that precise after the split.
0 -
Thanks Q - I found the place where the extended number of digits happened: a class conversion from one D&C class, I'll call it class 1, to class X. All previous transactions of D&C class 1 were added on the class conversion date with long share counts (six significant digits) and similar pricing. At that time, I likely added/subtracted 0.00000x shares to the final shares added to get back to the proper count (three significant digits).
I cannot go back to update that transaction without causing a similar ripple of # of shares from that time to the split.
I'm considering adding a 10/24 Buy of 0.000007 shares at the split price and adding any necessary negative commission to cause no impact to the cash balance of this account. Any issue with that approach?
Awaiting other input on how to get the Investing 3y/5y avg. annual return to show up properly.0 -
I'm not worried about the miscalculation one bit. As I have many years of dividend reinvestments I have a bunch of lots that show this long list of digits after the decimal point but at the top level of shares my Quicken number agrees perfectly with Dodge & Cox.
I'm not sure what exactly is causing the miscalculation on the return percentages - mine certainly looked reasonable - but looking more closely at a Market Value chart for the stock I did see a big "kink" in the chart right around the time of the split, so I did a Net Worth report with only the Account with the stock in it and only the D&C Stock fund as the selected security I did see this:
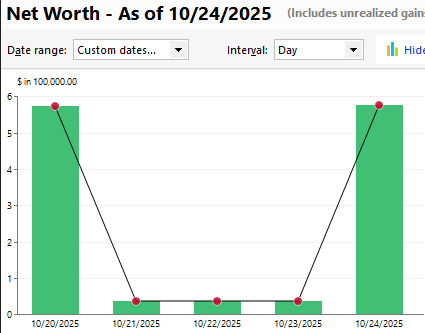
and looking at the Price History confirmed that some subsequent download of prices from Quicken (these shares are actually held at D&C and is a manual Account) pushed back the post-split prices 3 days before the actual split event.
Look at at a Market Value report for that stock located a few days before and after 10/24 and you might spot something that needs fixing.
0 -
Thanks Tom. I had never run a Net Worth report… learned something. I see the EXACT same days with a kink. Now I'm trying to look at the Market Value report but cannot find how to do that. Any quick "how to" for that you can send?
0 -
Update: I found the way to edit the incorrect historical prices for the 3 days, but that did not change the Investment Portfolio Avg annual return %'s. I figured that might happen since I made no share purchases on those days. Wish there was better debug capability on why the split blows up the investment avg. returns.
0 -
As to getting a "market value" look at a security, simply click on that security's name up in the Holdings window.
I believe the graph you'll see defaults to market value but if not, simply use the drop-down window and select that. Go to a view of all the time you've owned that security and see if something stands out.
Assuming you're referring to e.g., "Avg. Annual Return (%) 5-year" I don't think the split itself could have any effect on that calculation. That calc starts with the value of the security 5 years prior to "today", factors cash flows in and out (bus and sells) of that security during the 5 years, and the securities ending balance "today."
Since the split ISN'T a cash flow, it really shouldn't change that calculation at all. Are you sure about that "before split" number(s)?
0 -
A good tool to investigate average annual return values is the Investment Performance Report. That report can be customized to the same criteria you might be seeing elsewhere where - time frame, account(s), security(ies), etc.
When the settings are suitably dialed in, you can have the report show detail which will then expose the starting value, ending value, and relevant intermediate events that flow into the calculation.
0
Categories
- All Categories
- 6 Product Ideas
- 34 Announcements
- 250 Alerts, Online Banking & Known Product Issues
- 19 Product Alerts
- 265 Welcome to the Community!
- 301 Before you Buy
- 1.5K Product Ideas
- 55.8K Quicken Classic for Windows
- 16.9K Quicken Classic for Mac
- 1K Quicken Mobile
- 834 Quicken on the Web
- 129 Quicken LifeHub