Expected Rate of Return in Investment Allocation seems to be wrong

I have an investment allocation target in Quicken Windows of

When I use other tools to find expected return for the target allocation above, it comes back as 6.5% (nominal) return, a difference of 1.5%. Similarly, if I do a target allocation in Quicken of 60% equities, 40% bonds it returns 5% expected return, whereas the standard 7.5%, a difference of 2.5%.
Why are Quicken's expected returns so different from industry standards?
Answers
-
I did a simple experiment to try to find the underlying assumptions behind the Expected Return and Expected Risk. I made portfolios that hold 100% of each of the standard asset classes with the following results:
Asset Class Exp ret Exp Risk
- Large Cap 7% 16%
- Small Cap 8 20
- Int'l 8 18
- Dom. Bonds 2 5
- Glbl Bonds Unk Unk
- Crypto Unk Unk
- Cash 0 0
- 50/50 LC/Cash 3 7
These seem pretty reasonable, but of course no one knows what will actually happen or whether Quicken will revise these as market conditions change. I did not explore other asset class mixes.
It would sure be nice if there was a Help or Support article that explained the source and methodology behind these numbers.
QWin Premier subscription0 -
Thanks Jim
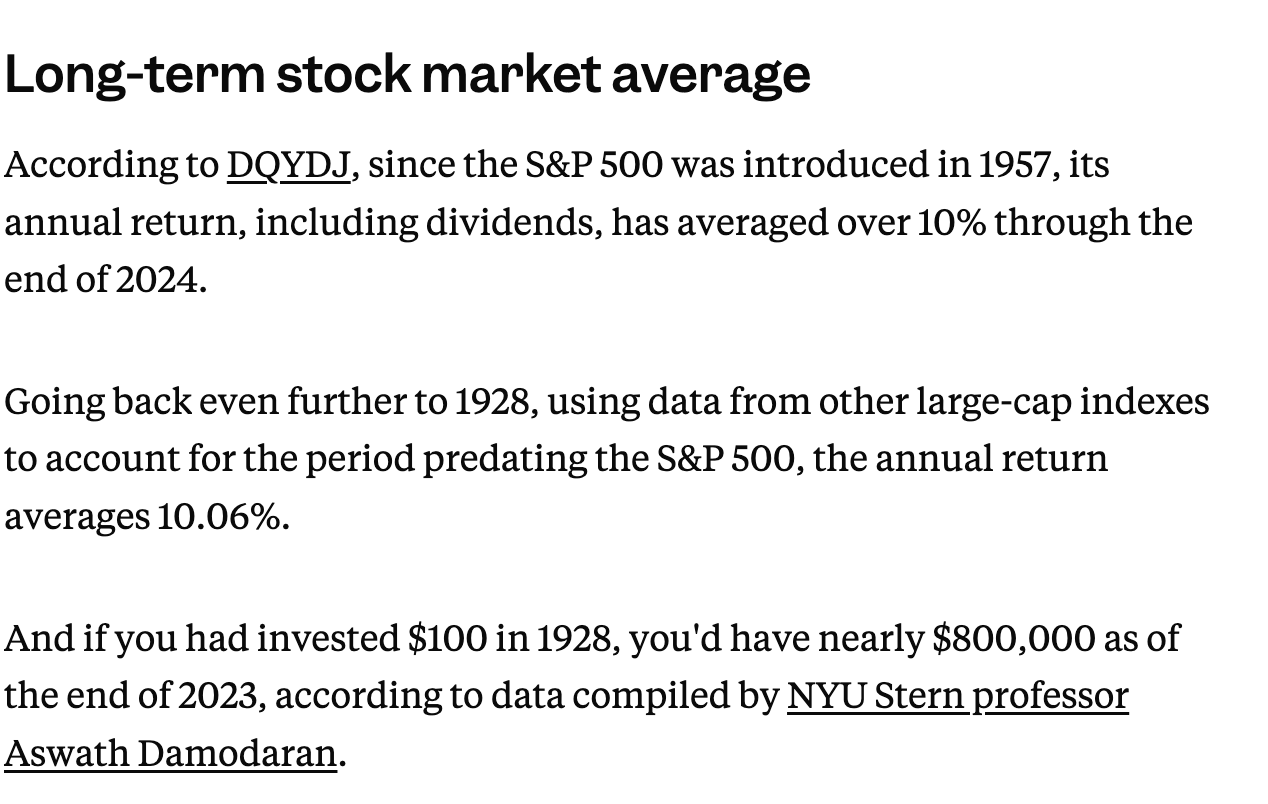
According to an article in Business Insider, average returns for S&P 500 are about 10%, which is quite a bit higher than the 7-8% you got from Quicken.
Investopedia comes up with 8.4% on S&P since 1928, lower than above, but higher than Quicken . . .
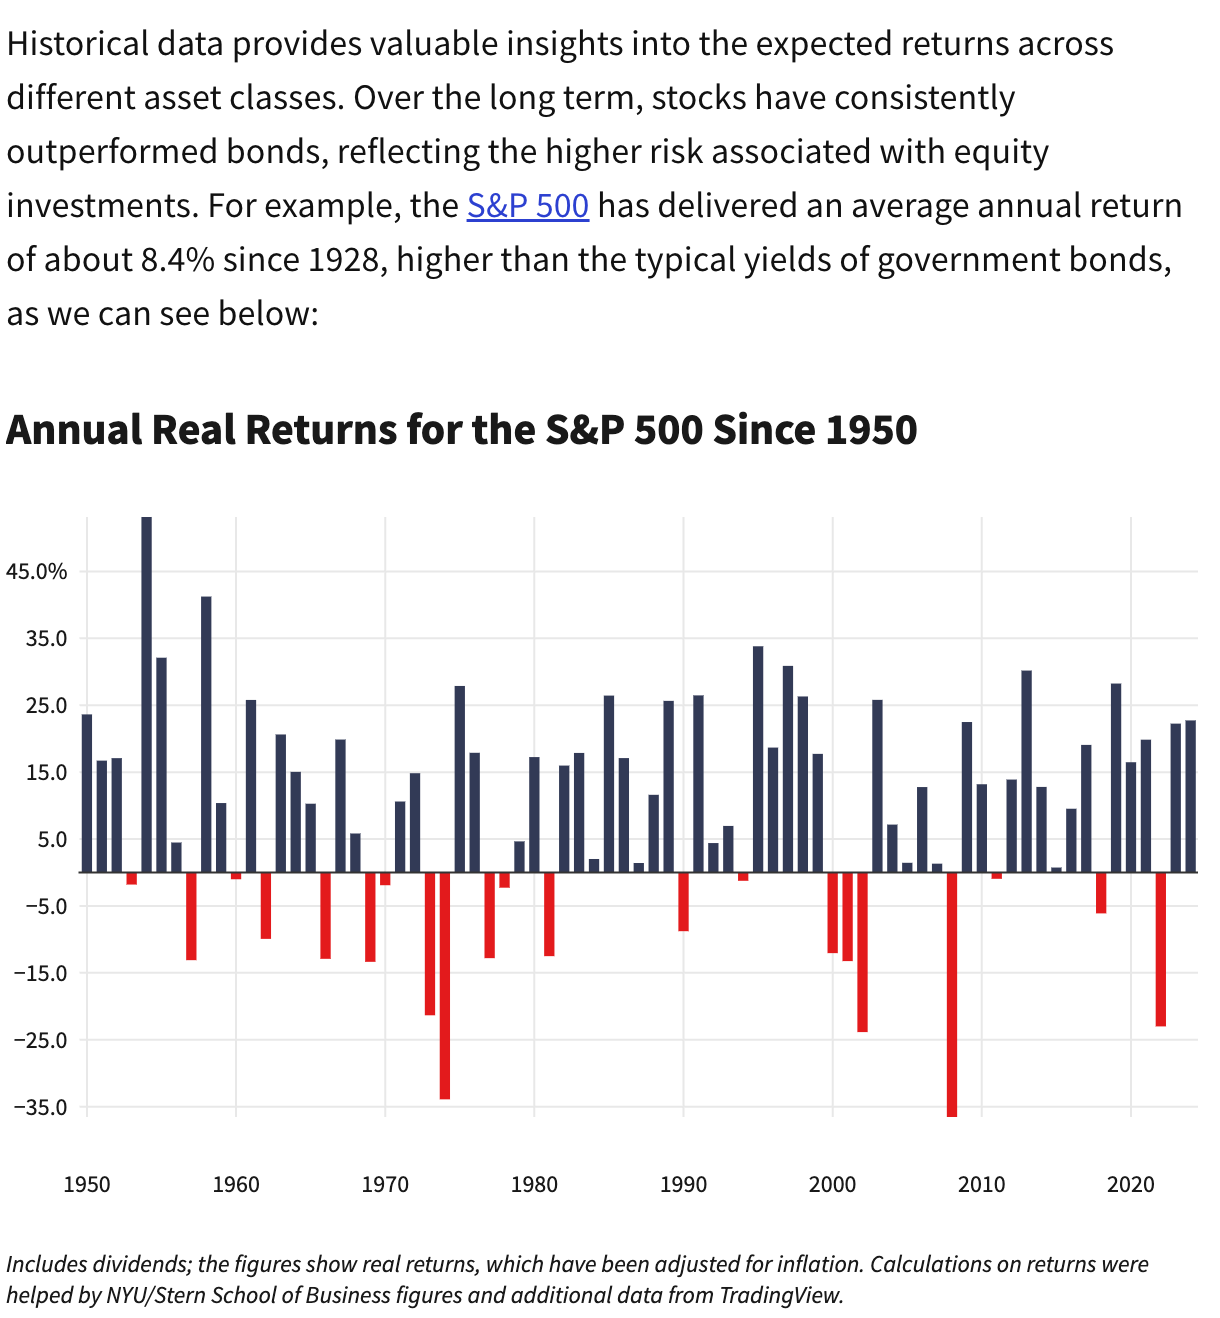
It would be good to understand wherein the differences in methodology and results lie.
0 -
Well, here is my take on that whole view.
To me it seems like even though they have done some tweaking to it lately because of putting in being able to put in your own asset classes the "underline information source" hasn't been updated and decades.
If you click on "Show Allocation Guide" you will get this:

This might not be much of a clue to the average person, but just like this one:

It screams to me as a developer that this was created in the last 1990s and early 2000s when Microsoft was trying to play catch up because it missed the takeoff of the Internet and was pushing the "web interface" even for Desktop applications.
It goes along with this:

Which BTW I can't even sync to anymore because in my data file the preference is gone!
I wouldn't be surprised if some of the analysts shown in here are dead…
Yep, the one I was thinking of died in 2022.
 0
0 -
Yes, my Portfolio X-Ray is consistently inaccurate & does not show bonds as part of portfolio, not to mention CDs, and I have major errors in investment account uplaods to Quicken online, such that the app is worthless. So maybe they've not been paying attention to these functions for some time . . .
0 -
For what it is worth, the X-Ray portfolio is pretty new. It doesn't really fall into the exact same category (except in the same way that it is a feature they put in and then seemed to abandon it, and probably has problems because of trying to use the other outdated asset information in the other areas).
But it is "just a web page", so it "looks similar". It seems to be that Quicken gathers/maps your assets in some form and sends it to MorningStar, and gets in return the web page. From what I have seen of that feature there is a bug that has been there from the beginning that doesn't properly select accounts/securities and it forces you to reselect them to even get it to display anything. But on top of that there seems to be a disconnect between the "security asset groupings" in Quicken in comparison to what MorningStar and then on top of that what MorningStar even has information on (at least for this service that they are providing to Quicken) seems to not include a lot of different asset types.
0 -
Thanks Chris. As they say, life is complicated .. .
0 -
I find the Portfolio X-Ray to be very useful, but we must understand its limitations.
- As mentioned above, the account and security selection is glitchy. I think this has improved recently.
- The analysis only includes securities that are in Morningstar's database, so it only includes publicly traded securities that have valid ticker symbols. Many 401(k) holdings such as stable value funds, special 401(k) funds, etc. are ignored.
- Morningstar's high level asset classes do not line up with Quicken's. Global bonds are lumped with Bonds for example.
- There is still no way to print the X-Ray report.
QWin Premier subscription0 -
I have always blamed this issue on the trade off between paying someone like the Newport group to crank out data using rigidly defined asset classes (as was the case in the past) vs giving users the ability to add their own asst classes. See below regarding past discussion
What is very clear however is that Quicken needs to be more forthcoming as to how returns and risks are calculated.
Quicken Business & Personal Subscription, Windows 11 Pro
0


