Lifetime Planner Monte Carlo Analysis (NEW)

Langston Holland
Langston Holland Quicken Windows Subscription Member ✭✭✭✭
edited April 23 in Investing (Windows)

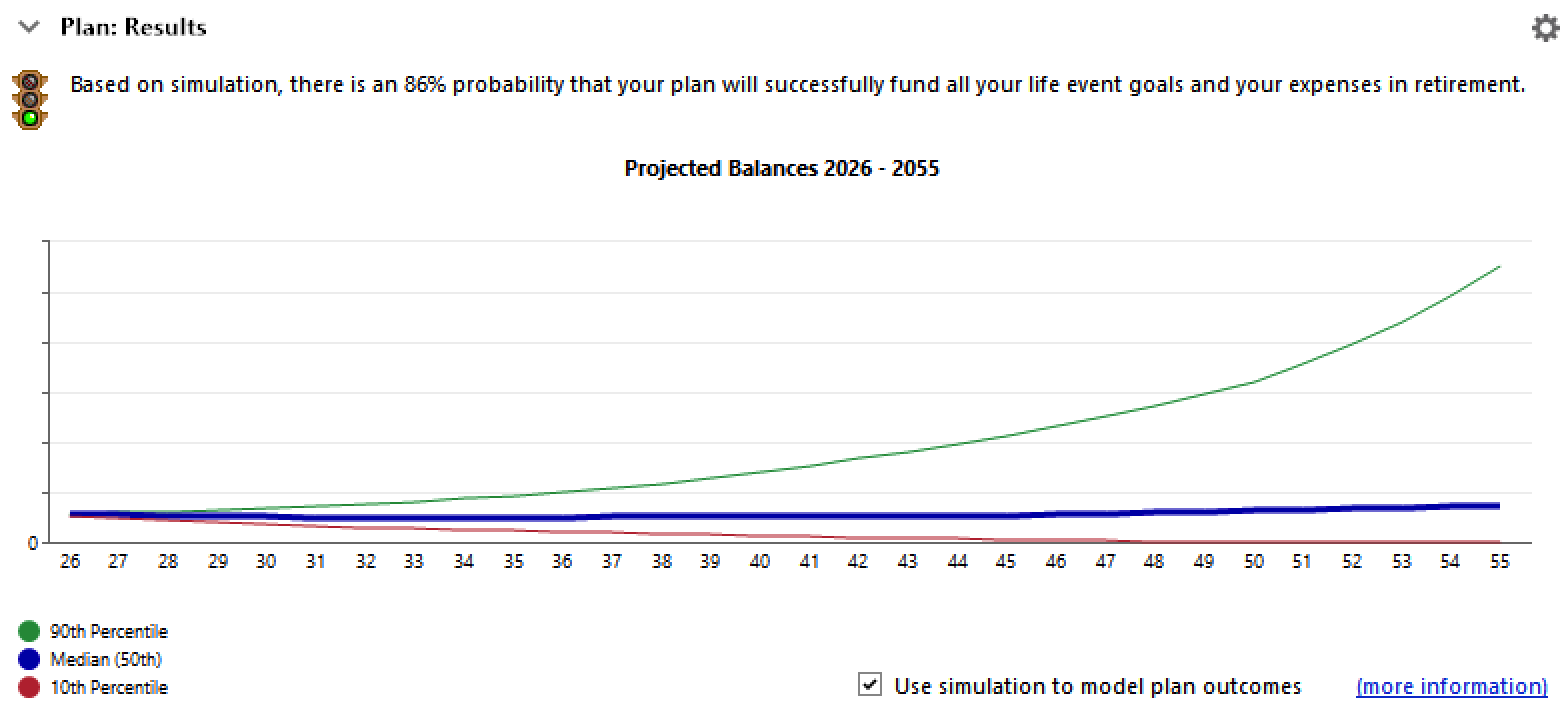
What a nice surprise - and well implemented. The 90/50/10 percentiles are industry standard and an excellent decision. Results are consistent with the excellent models available with Fidelity and Empower accounts, but Quicken is the only planner that adds future transactions to the user's current holdings for analysis.

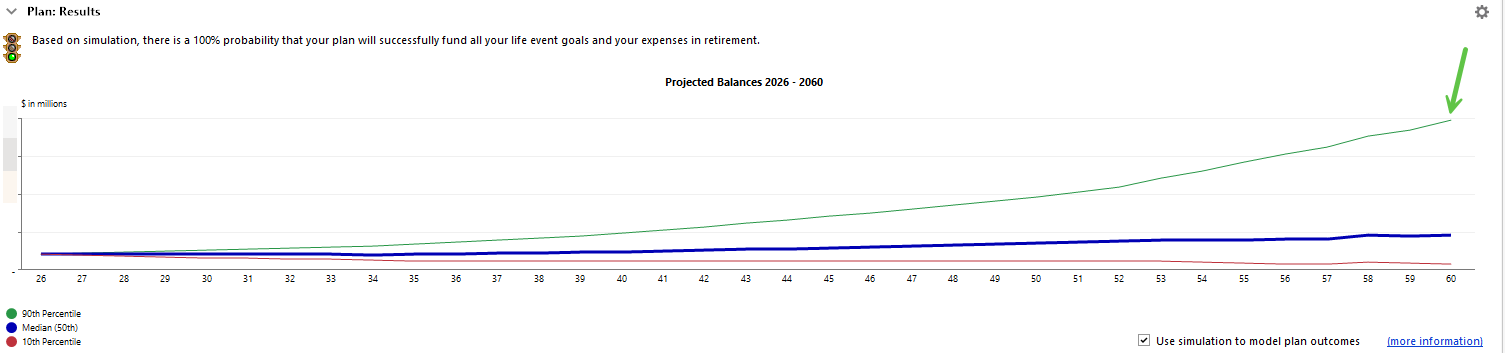
One Ask: Autoscaling of the Y-axis forces the all-important 10th percentile line so close to the X-axis that it's hard to see in my case. Please add selections to separately enable/disable the 90th and 50th (median) percentiles to improve visibility of the 10th percentile trace.

Thanks!

Lifetime Planner.png
God bless you and your precious families - Langston

Comments

  • BK
    BK Quicken Windows Subscription Member ✭✭✭✭

    @Langston Holland , How did you get this graph? I am not able to find it!

    - Q Win Deluxe user since 2010, US Subscription
    - I don't use Cloud Sync, Mobile & Web, Bill Pay

  • Langston Holland
    Langston Holland Quicken Windows Subscription Member ✭✭✭✭

    If you have the latest update, you should see this option (checkbox) at the bottom right of the standard Lifetime Planner histogram.

    Update.png
    God bless you and your precious families - Langston
  • BK
    BK Quicken Windows Subscription Member ✭✭✭✭
    edited April 23

    Thanks, that explains it. The latest one must be in a limited staged release and is not available to everyone yet - but I see where I can download it from.

    - Q Win Deluxe user since 2010, US Subscription
    - I don't use Cloud Sync, Mobile & Web, Bill Pay

  • Chris_QPW
    Chris_QPW Quicken Windows Subscription Member ✭✭✭✭
    edited April 23

    Did they fix the RMD date?

    EDIT: I found out that they have the manual patch available. At the moment I forget how to check for the RMD date, and I'm off doing something else, will check later.

    EDIT2: They haven't fixed the RMD date.

  • Scooterlam
    Scooterlam Quicken Windows Subscription SuperUser ✭✭✭✭
    edited April 23

    While its good to see some effort put into Lifetime Planner, I wonder why the developers did not opt to implement the "Add a Comprehensive Tax Model in LTP…" Idea as a prerequisite to this Monte Carlo feature?

    The immediate issue (I suspect) in the sim result, is a ridiculously high 90% portfolio result (image at end). This is likely due to the fact that the tax rate % assumption remains fixed. A fixed tax rate assumption will not work well for both the "old" deterministic simulation (Linear) and the "new" Stochastic simulation (M/C), even with the separate before/after rates in the assumption dialog.

    Why? Because in the high return runs in the M/C simulation, the much higher RMDs only are taxed at the average tax rate assumption and not against the marginal tax rates proposed in the Idea. So, as tax-deferred accounts get larger and larger in the high return runs, the RMD gets significantly larger and M/C results do not take enough tax expense out of the portfolio balance and thus the overstates 90% level.

    Note that this issue is less noticeable at median and 10% levels and less noticeable for those without tax-deferred accounts (401k, IRA et al). It may have an affect on the success % rate as well.

    Since the comprehensive tax model idea was archived due to loneliness, it should have been considered as part of the development plan for the MC feature. Maybe it was. I've attached a pdf of the idea thread for those who might be interested, below.

    Regarding the historical rate of return and deviation assumption used in the MC feature, I would say that it would be much better to use the existing user's assumptions rather than "blending all asset classes for the years 1928 to 2023" and what appears to be an arbitrary std of 12%. In LTP today, the user provides a rate of return and an inflation rate based upon (presumably) their future portfolios "weighted rate of return". Its a simple formula to calculate the real-rate of return. The only remaining assumption is the std which is also based on the users weighted rate of return. Of course this then becomes a forward looking assumption, but I think that the historical assumptions for the M/C sim are odd.

    Perhaps some additional transparency on how this was "put together" might give some additional confidence that the feature is reasonably sound.

    image.png
  • Langston Holland
    Langston Holland Quicken Windows Subscription Member ✭✭✭✭
    edited April 24

    Interesting idea. I enjoyed thinking about it, but I can see why it may never see the light of day. The Lifetime Planning module already affords a much higher level of granularity than available elsewhere that I'm aware of. At some point they have to decide where things get too busy speculating about the unknown (the future).

    You're right to point out that the 90th percentile is overstated with increased taxation in this happy event, but that likely won't affect the much more important 10th percentile in the same way - poorer returns may even understate it (be overly conservative), which is great IMO.

    What is interesting (that the Quicken help points out) is the gap between the 90th and 10th percentiles. Mine is wider than yours and likely due to my near 70% allocation in equities. I may be able to pull my 10th percentile trace up a bit with more bonds at the cost of ending net worth if everything is rosy. Of course that assumes I can't reduce spending, which I can easily cut in half if I stop gifting my kids. Lots of interesting variables, and Quicken helps thinking about them.

    If Quicken were to add a variable tax rate, they should also allow variable inflation and investment return rates. I modify those rates sometimes just to see the effect and then go back to my best guess. Inflation changes are quite sobering.

    The stochastic method of Monte Carlo analysis provides a reasonable variation on future investment return rates with its 200 iterations of the 1928-2023 market data. Since the market data used is real (adjusted for inflation), it also provides for the effects of variable inflation somewhat. Tax changes affect the market to a lesser extent, but there is also a bit of that in the real data. Hope we never see the 70's markets again. Overall, Monte Carlo is a lovely addition.

    Just for fun, my "86% probability" of success simply means that 172 of the 200 iterations cleared being broke at the highest date on the graph (0.86 x 200 = 172). My 10th percentile trace likewise intersects the X-axis (broke) approx. 86% of the way to the highest date.

    Yours is 100%, but there ain't no such thing as 100% about the future. :) Planning and paying attention is the best we can do, and Quicken is extremely helpful in that regard.

    God bless you and your precious families - Langston