Numbers Overlapping in Spending Report Graph

This seems like a bug to me. I don't see any place where I can change formatting, and I use the same procedure each month and this is the first time this has happened to me. I think there has been an update or two since the last time I tried this; I suspect something got messed up in the update. Has anyone else seen this and does anyone have any guidance? Thank you.
Comments
-
Does is make a difference if you choose landscape for the page orientation?
Quicken user since Q1999. Currently using QW2017.
Questions? Check out the Quicken Windows FAQ list0 -
I can confirm this problem on my R 48.15 using 8.5*11" paper in landscape mode
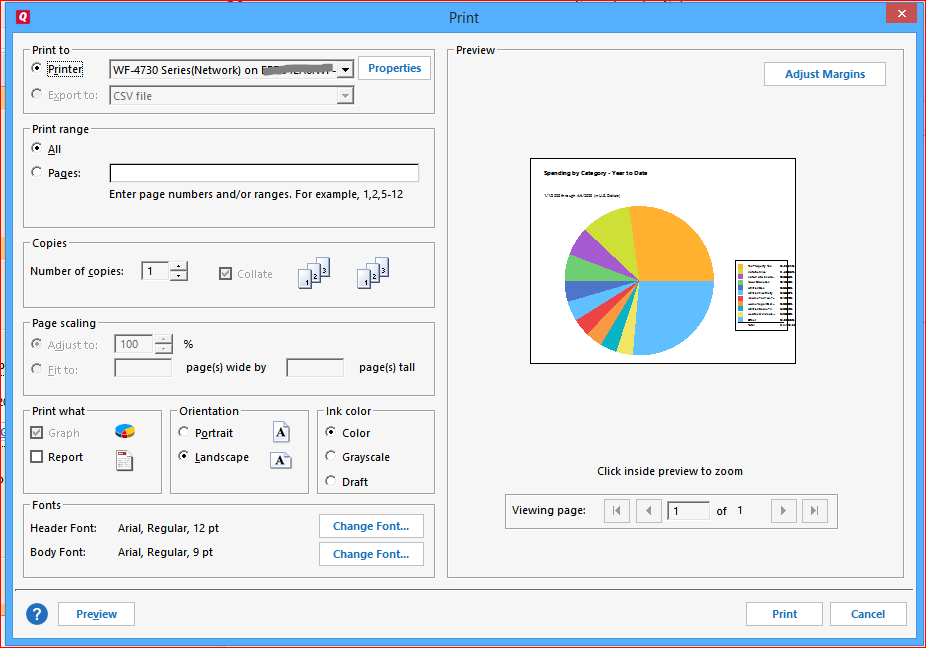
The graph is too big and does not leave enough space for the legend to print the category name, amount and percentage columns.
Changing the Body Font to 8 pt makes no visible difference.The programmers should take a look at that.
0 -
This was reported about a week ago. Make sure to do Help > Report a Problem and include a screen shot.
I proposed a clumsy workaround in the other thread.
Quicken user since version 2 for DOS, as of 2025 using QWin Premier (US) on Win10 Pro & Win11 Pro on 2 PCs.
0 -
Hello @nopeatnopedotnope,
Thank you for taking the time to visit the Community to report this issue, though we apologize that you are experiencing this.
I was able to recreate this issue and have forwarded it along to the proper channels to have this further investigated. In the meantime, we request that you please navigate to Help > Report a problem and submit a problem report with log files attached in order to contribute to the investigation.
While you will not receive a response through this submission, these reports will help our teams further investigate the issue.
We apologize for any inconvenience! Thank you.(CTP-6234)
-Quicken Jasmine
Make sure to sign up for the email digest to see a round-up of your top posts.
0 -
Since upgrading to the most recent release (R48.15, Build 27.1.48.15), I can no longer print (or create a PDF) of a properly formatted asset allocation report. The pie chart prints no problem. However, the text descriptors, dollars and percentages by asset category are overlaying each other on the righthand side. Before hitting Ctrl P to print, the report looks fine. However after hitting Ctrl P to print, even the print preview screen is not properly formatted. I have tried resetting printers. Uninstalling the app and reinstalling. Nothing seems to solve the formatting issue when printing. Is anyone else having this issue? UPDATED NOTE: I just happened to have an older version of Quicken on a different computer. I moved the same file to that computer and was able to format and print an asset allocation report (PDF and paper-based) no problem, so it appears that the current printing issue has been introduced with the latest release of the software?0
-
UPDATED NOTE: I just happened to have an older version of Quicken on a different computer. I moved the same file to that computer and was able to format and print an asset allocation report (PDF and paper-based) no problem
@SLFP Can you please tell us the release number of the version that works for you?
Quicken user since version 2 for DOS, as of 2025 using QWin Premier (US) on Win10 Pro & Win11 Pro on 2 PCs.
0 -
I have the same problem. I finally found where to "report" the problem but seems it has already been reported earlier and the issue still exists. Since it only occurs when "printing", I did try the work-around to screen capture, but this is very cumbersome when trying to merge both the report and graph. (Note: I tried several printer options and it does it for all). I even tried to convert from PDF to Word to edit the size of the box, but the data just wraps so that did not work either.
0 -
It seems that the quality assurance testing for update builds is truly inadequate. I have the same problem with the asset allocation report.
1 -
I have the same trouble with version R49.29. The report looks fine on screen (messed up in Print Preview and when printed) so as a workaround, I am taking a screen capture and printing that.
0 -
I'm having the same issue with version R49.33 for Portfolio Value by Account and Portfolio Value by Investment reports in both portrait and landscape modes. This issue has been ongoing since at least early April.0
-
If and when you can download and install Release R 50.5 in the next few days, this problem has been resolved.
Do a Help / Check for Updates and see if the patch update is available for you.
The full (aka Mondo Patch) Update file has not yet been released.0 -
perhaps, but other problems arise see Tax Summary zeros.
0