Missing Values in Return (%) Column Values: Portfolio View

Hi,
So the three columns, Return (%) 1-Year, 3-Year, and 5-Year have missing values for certain securities in my account. Most of my securities simply have N/A, which makes sense, since many I've held for less than a year. But certain securities don't have N/A, but are simply empty. These missing return values I suspect should be a value other than N/A. One of my oldest securities for example is VTI. I should have Return (%) values for the 1-Year and 3-Year column. But they are blank. Has anyone experienced this? Has it been reported elsewhere? Is there a fix?
Answers
-
Hello @recursor1,
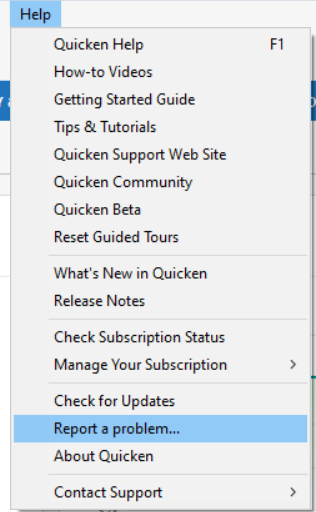
Thank you for letting us know you're also seeing this issue. This issue has already been reported to our teams, but they do need more information to investigate the issue. Please navigate to Help>Report a Problem and send a problem report with log files attached. If possible, please also include a screenshot showing the blank entries on the portfolio view.
Note - Problem reports allow a maximum of 10 attachments. If you need to send more than 10 attachments, please use a second problem report for the additional attachments.
Please let me know when you send the problem report, so I can add it to the ticket.
Thank you!
(CBT-647)
Quicken Kristina
Make sure to sign up for the email digest to see a round up of your top posts.
0 -
No, they don't need my data to fix this. It should be a simple fix for your devs.
0 -
a) I honestly don't understand why Quicken has such a hard time getting the explanations of the Portfolio columns right.
- Return 1-/3-/5-Year and YTD are indicated as based on "Income (downloaded)"
- Return (%) 1-/3-/5-Year and YTD are not listed
The "Return" values are in dollars (or other currency unit if applicable) and are based on your transactions and holdings. The following page gives an example of a return calculation where some shares were sold. The example lacks inclusion of dividends which would also be part of the return.
The Return (%) values are all (currently) downloaded parameters that (should) include dividends and related historical events but will not include the users actual transactions. Some time ago, IIRC, only the YTD % was downloaded and the others were calculated.
b1) I don't understand why some Return (%) fields are NA and some are blank. For my holdings, I am not seeing a correlation to when I acquired the shares.
b2) Given that the four Return (%) values are downloaded, I don't understand why all 4 versions are not all presented. The only exception would be for a security that did not exist 1-, 3-, or 5 years ago. Otherwise, present the value.
b3) I don't understand why the values are given to a precision of 0.0001%. Can't imagine a data supplier is presenting them that way.
b4) A footnote identifies Return (%) YTD is unaffected by the As of date for the view. That appears to be true for all four Return (%) values.
0 -
Please see this discussion for a detailed description of these and related problems with the Return (%) data.
For me, the N/A entries are for securities that I do not currently hold, including those on the Watch List. Because the Return (%) numbers are are downloaded and not based on users' transactions, I don't see any reason why this data should not be displayed. Particularly for securities on the Watch List, I think it would be useful to be able to see the historical returns.
QWin Premier subscription1 -
@Jim_Harman , I somehow missed that these were downloaded values. I thought they were calculated values, which I think would be much nicer. That's…unfortunate. It would be real nice if Quicken would either lean into Morningstar more and resolve these issues, or move away from them.
0 -
@recursor1, if you want to see your personal return for securities you hold, I think Quicken's best measure is the "Avg. annual return (%)" columns. These do an IRR calculation and take into account the amounts and timing of your transactions and any distributions. The calculation matches Excel's XIRR function and is the same as in the Investment Performance report.
Note that these returns are annualized, so they may not be meaningful for periods of less than one year. For YTD returns, I find the ROI (%) YTD column most useful.
QWin Premier subscription0 -
@Jim_Harman , one thing I don't get about ROI YTD is why so many of my recent acquisitions don't have a value (N/A). I would think you'd still be able to calculate that even if the gains are losses are very recent.
0 -
Here is a lengthy discussion about the ROI (%) data and how it is calculated.
Based on that, I don't see any reason why Quicken should not show a value for ROI (%) for a security if the starting value was zero.
But you are correct, it shows N/A.
QWin Premier subscription0 -
Very very frustrating.
0


Categories
- All Categories
- 23 Product Ideas
- 34 Announcements
- 247 Alerts, Online Banking & Known Product Issues
- 19 Product Alerts
- 265 Welcome to the Community!
- 300 Before you Buy
- 1.5K Product Ideas
- 55.8K Quicken Classic for Windows
- 16.9K Quicken Classic for Mac
- 1K Quicken Mobile
- 834 Quicken on the Web
- 128 Quicken LifeHub